Introduction
Since the 1970s and 1980s, cultural geographers, philosophers, and ecocritics have been redefining our idea of place and our relationship to it. Rather than a static location or setting, we now understand place as comprising multiple, entangled layers, including individual, social, and geographical components (Cosgrove 1984; Massey and Thrift 2003; Mels 2004). Lawrence Buell identifies a fundamental problem with the word place, which has “by definition both an objective and a subjective face, pointing outward toward the tangible world and inward to the perceptions one brings to it” (Buell 2009, 59). However, given the ubiquity of services such as Google Maps and our typical interactions such as searching for directions, we tend to conceive maps as universal and objective.
By contrast, “deep maps” accentuate both the subjective and constructed nature of mapping. David Bodenhamer defines a deep map as
a platform, a process and a product. As platform, it is an environment embedded with tools to bring data into an explicit and direct relationship with space and time. As a process, it is a way to engage evidence within its spatiotemporal context and to trace paths of discovery that lead to a spatial narrative and ultimately a spatial argument. As product, it is the way we make visual the results of our enquiry and share the spatially contingent argument enabled by the deep map. (Bodenhamer 2016, 213)
Much of the current work in deep mapping has been developed in a literary context as a way of examining the complex relationships between place and text (Cooper, Donaldson, and Murrieta-Flores 2016; Bodenhamer 2015; Taylor et al. 2018) and between real and imagined places (Piatti et al. 2009). As products, deep maps provide a way to visualize the intersections of text and place in new ways, leading to a complex understanding of both.
In their overview of the current state of digital mapping, Joanna Taylor and her colleagues at Lancaster University highlight the persistence of spatial approaches to literature in the humanities, starting with nineteenth-century literary atlases (Taylor et al. 2018). Computation makes novel, interactive forms of mapping and visualization possible. For example, a literary text might be mapped to reveal the spatial relationships within a narrative, as in the now classic “Litmap,” a map of W. S. Sebald’s Rings of Saturn (Hui 2021). In this project, Barbara Hui maps every place and route described in Rings of Saturn and digitally pins extracts of text to the mentioned locations, creating a networked text that can be read spatially. Repeated referrals to specific places appear as layers and can be quickly identified, and each path offers an alternate way of navigating the source text. This type of literary map, or spatialized text, displays both narrative and conceptual structures in relation to place. In an alternate approach, extracts of place-specific texts from multiple sources are mapped. Rather than using the map to critically analyze a primary source text, this type of project prioritizes 1) changing depictions of places over time, and 2) ways that literary representations of place may have influenced later texts or shaped impressions of a place.
These two mapping methods can also be combined. Gary Priestnall describes the “Mapping the Lakes” project by David Cooper and Ian Gregory as “a literary GIS of the English Lake District which reconstructs journeys made by poets from place references and also derives maps of their emotional responses to the landscape” (Priestnall 2016, 241). English Romantic writers are placed in a spatial context, allowing, for example, comparative analysis between writers through visualizations of their specific tours of the Lake District, more accurately pinpointing the exact places that engaged their imaginations. At the same time, the map gives a sense of how the idea of the Lake District developed over time through these compositions and how these literary works may have influenced each other and their representations of this place.
But what about the process of mapping itself and the tools that are used to construct these visualizations—of deep mapping as a platform and as a process rather than the maps as products? While many tools already exist for mapping and telling stories about place, such as Google Maps, StoryMapsJS by Knight Lab, and ArcGIS StoryMaps by ESRI, pre-existing software tools set the expectations of what kind of stories can be told, how they will be navigated, and the types of “data” that can be incorporated into a map. Many have, of course, created engaging narratives about place through these platforms, and the boundaries of a tool can also be compelling, much like the limitations of a sonnet form might inspire a surprising rhyme or play on words. Tools can be used in unexpected ways. However, the process of deep mapping can also include a determination of which elements belong in the map: what constitutes “data” that should be represented, from text to various types of media. The act of omission is also part of authorship.
Our approach to deep mapping is constructionist (Ackermann 2001; Papert 1980), meaning that the map represents an author’s mental model of place—whether this author is a scholar or a community member. Rather than a finished product, the map is an “object to think with” (Papert 1980, 182) and part of an iterative process of engaging or re-engaging place. As such, authorship is critical to both the map and to the development of the mapping tool, and in the case studies below, we describe collaborations with authors and organizations to create the tools they needed to tell their own stories about place. The Neatline project from the University of Virginia’s Scholar’s Lab takes a similar approach of emphasizing both the iterative design process and the subjective and interpretive elements of both mapping and text analysis (Nowviskie et al. 2013), but we had a slightly different goal of connecting individuals and communities to place physically (in addition to through digital representation). This motivated our development of an entirely custom tool which could produce both web-based instances and mobile applications.
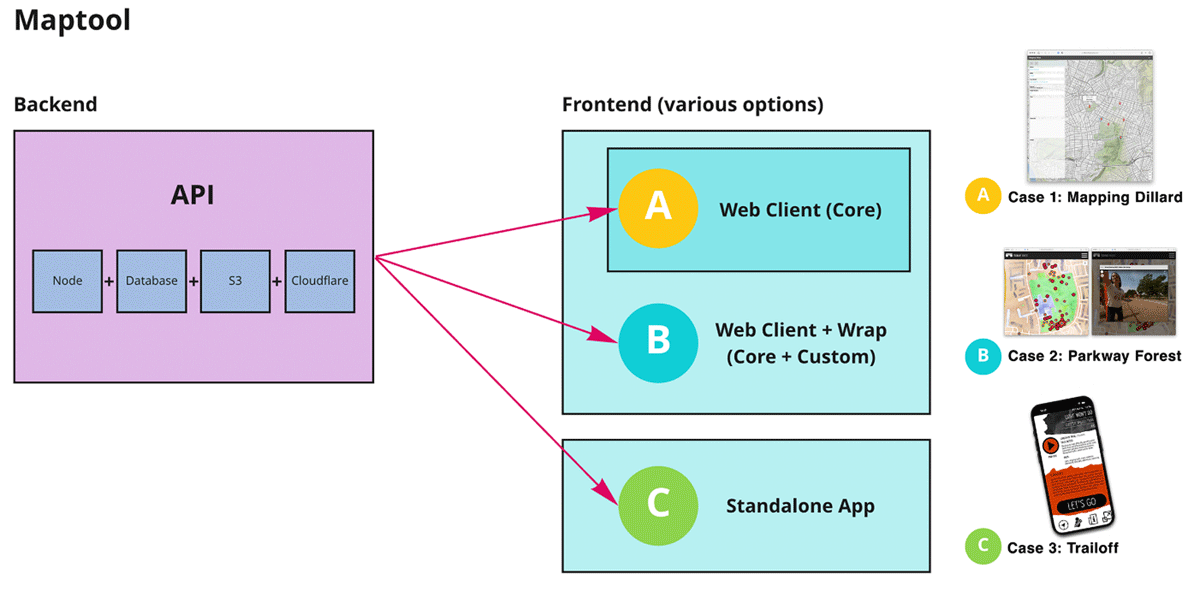
“The MapTool” refers to a collection of tools, techniques, and software that allow for the creation of interactive map-based projects. These maps are digital and highly customizable and may contain “points of interest”: marked coordinates which themselves contain information about a location as well as pointers to media including images, audio, video, text, and web pages. The MapTool has three main use cases, which we will explain below. Each case facilitates a different relationship between place and its representation, allowing us to explore the ways in which our sense of place may change through the creation of deep maps. As seen in Figure 1, each use case shares the same backend, and the frontend varies according to the purpose of the deep map. The MapTool offers a means to subvert the idea of one cohesive and officially authored narrative about a space. Instead, we posit that digital maps can highlight meaning as co-constructed through layering.
Case study 1: Direct use, Mapping Dillard
The first use case for The MapTool is the most “traditional,” insofar as the digital humanities has traditions: it allows a scholar to spatialize a text. In addition to linking source texts to place, The MapTool can be used to layer media or other subjective materials onto the “official” map of the text. We call this approach “direct use,” as The MapTool presents a web-based interface which allows the author to place and manage pins on a map, including uploading and assigning media and links to those locations. In a “published” or public version of the map, the author and the audience share the same interface.
Used in this way, The MapTool presents a web-based application with a tiled map that can be zoomed, pinched, and scrolled. One can place and manage pins on a map and optionally upload and assign media and links to those locations. There are timeline and playback features, allowing for the capture, presentation, and navigation of data that is entered. The ability to specify and directly edit the data and presentation style of each point of interest makes The MapTool’s direct use case different from an environment like Google Maps, although the general interaction will be familiar. The specific types of media and metadata that The MapTool supports were developed in a collaboration between this paper’s authors in order to map and interpret a specific literary text.
Mapping Dillard
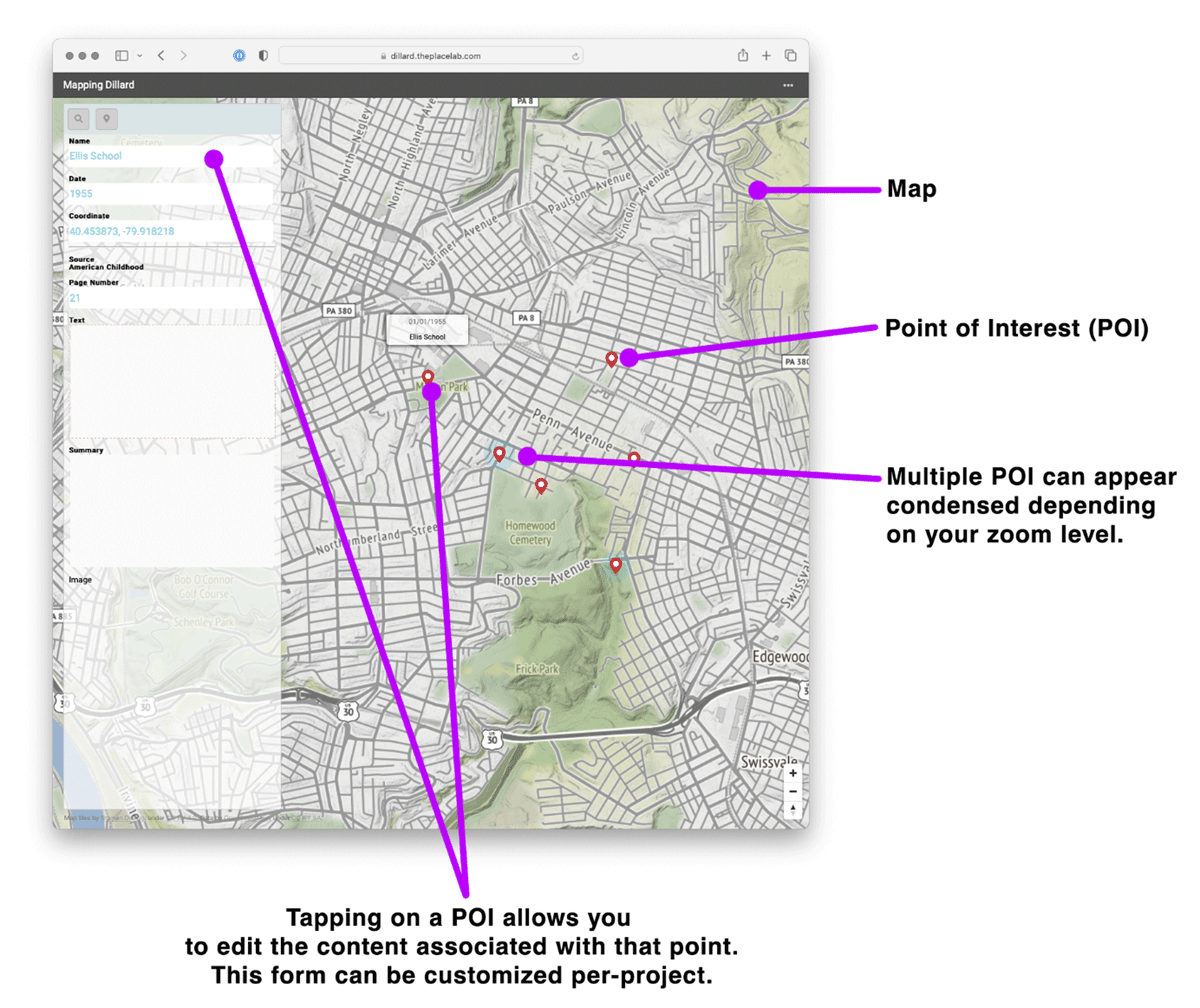
Author Annie Dillard grew up in Pittsburgh, Pennsylvania, in the 1950s, and her memoir An American Childhood documents her early years. The text mentions landmarks, roads, churches, baseball fields, schools, etc. that still exist today. Anindita Basu Sempere, one of this paper’s authors, used an instance of The MapTool to place the locations mentioned in Dillard’s text, creating what we describe as the first form of literary map: a presentation of the spatial relationships within a text (Figure 2). This initial map demonstrated how, as Dillard grew up, the circumference of her daily life expanded, especially once she got a bicycle. This observation was interesting but not particularly profound, and the primary research goal was to examine the relationship between place and poetics, specifically the relationship between topography and text. Topography can be viewed on a tiled map, but the physical experience of place differs from a visual representation, so Anindita decided to “walk” the map of the spatialized text and to document the experience through geotagged photos and notes. This first-person experience of the map was then uploaded using The MapTool, adding a contemporary layer to the literary map of Dillard’s text, essentially creating a “thick description” (Geertz 1973) of the places that appear in the text.
By overlapping contemporary experience and interpretation and the source text, the map itself represents a conversation between scholar, text, and place. It is in a sense a collaboration over a span of time. Although the initial goal of walking the map was to better understand physical place in relation to the spatialized text, in doing so, this was no longer a map of Dillard’s text. Instead, the place was mediated through the map, and a new co-authored map was created through this process, foregrounding the interaction between authorship, memory, place, and text—a process that is especially pertinent to the memoir form and to the subjective nature of interpretation.
The process of remapping Dillard’s text and adding to the map subverts the authority of the original map. Rather than providing a spatialized way of navigating the text, Mapping Dillard highlights how the present intrudes on our reading of the past and the instability of both place and memory. We see the seams between authorial perspectives on place and text, and by juxtaposing the present place with the past, we read change as part of the story of this place, although that is not explicit in the original text.
Case study 2: Wayfinder, Parkway Forest
As a wayfinder, the MapTool can be used to guide audience members to specific physical locations in order to launch an additional experience, which might be a website, a YouTube video, an instance of AR through a platform like 8th Wall, or any other material that can be shared online. In this mode, the tool can be further wrapped by a host website so that the map view becomes a part of a site, which includes additional information, branding, or media that situates the map in a particular context. In this mode, the map is accessed directly by both the author and the audience, although typically there is a larger temporal gap between creating the map and interacting with it than we saw with Mapping Dillard. The MapTool is used to author a map at one point in time and then stands as a record for viewing at a later point in time.
Parkway Forest
Parkway Forest is both a neighbourhood and a park in Toronto, Canada. The area was developed in the 1960s in classic modernist “machine-for-living” mode: it consists of high-rise buildings stacked on top of extensive parking with a large, open, grassy area in its centre. It is bounded on two sides by a major highway, and as with most of the early modernist utopian program, it has had mixed success in terms of providing ideal living conditions. However, recently it has been the subject of grassroots community work to revisit and redevelop the plan. Part of this work has been an ongoing discussion with the community about their use of public space, in particular of this park.
The Parkway Forest project began in 2018, prior to our involvement, and initially had no direct relationship to maps or mapping. Originally, our project collaborators Justine and Ian Garrett of Toasterlab conducted workshops that engaged local children to tell stories and produce films about this shared, local place. During these workshops, participants were given access to equipment, including 360-degree cameras, which are designed to film a 360-degree view, capturing a complete “dome” around the camera. The resulting films do not necessarily have a point of focus; rather, the viewer is invited to manipulate the point of view as the film plays.
In 2014, Google sponsored a low-cost VR prototype project called Google Cardboard, which allows the user to view 360-videos (such as those created during these workshops) in simulated immersive-VR, using only a mobile phone and a cardboard prosthesis that converts most personal mobile devices into a rudimentary 3D-viewer. In this way 360-degree videos can be viewed by standing in a location and moving one’s head and body, getting a “first-person” experience of the place where the user or audience member is standing, except shifted in time.
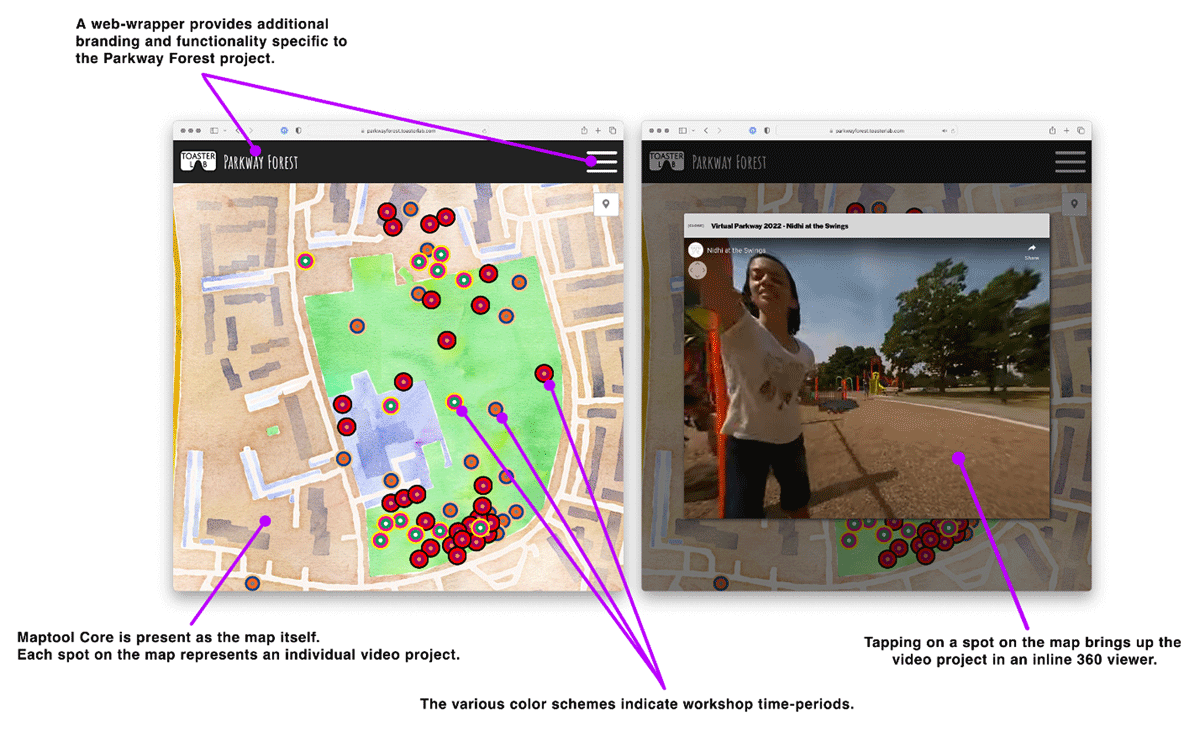
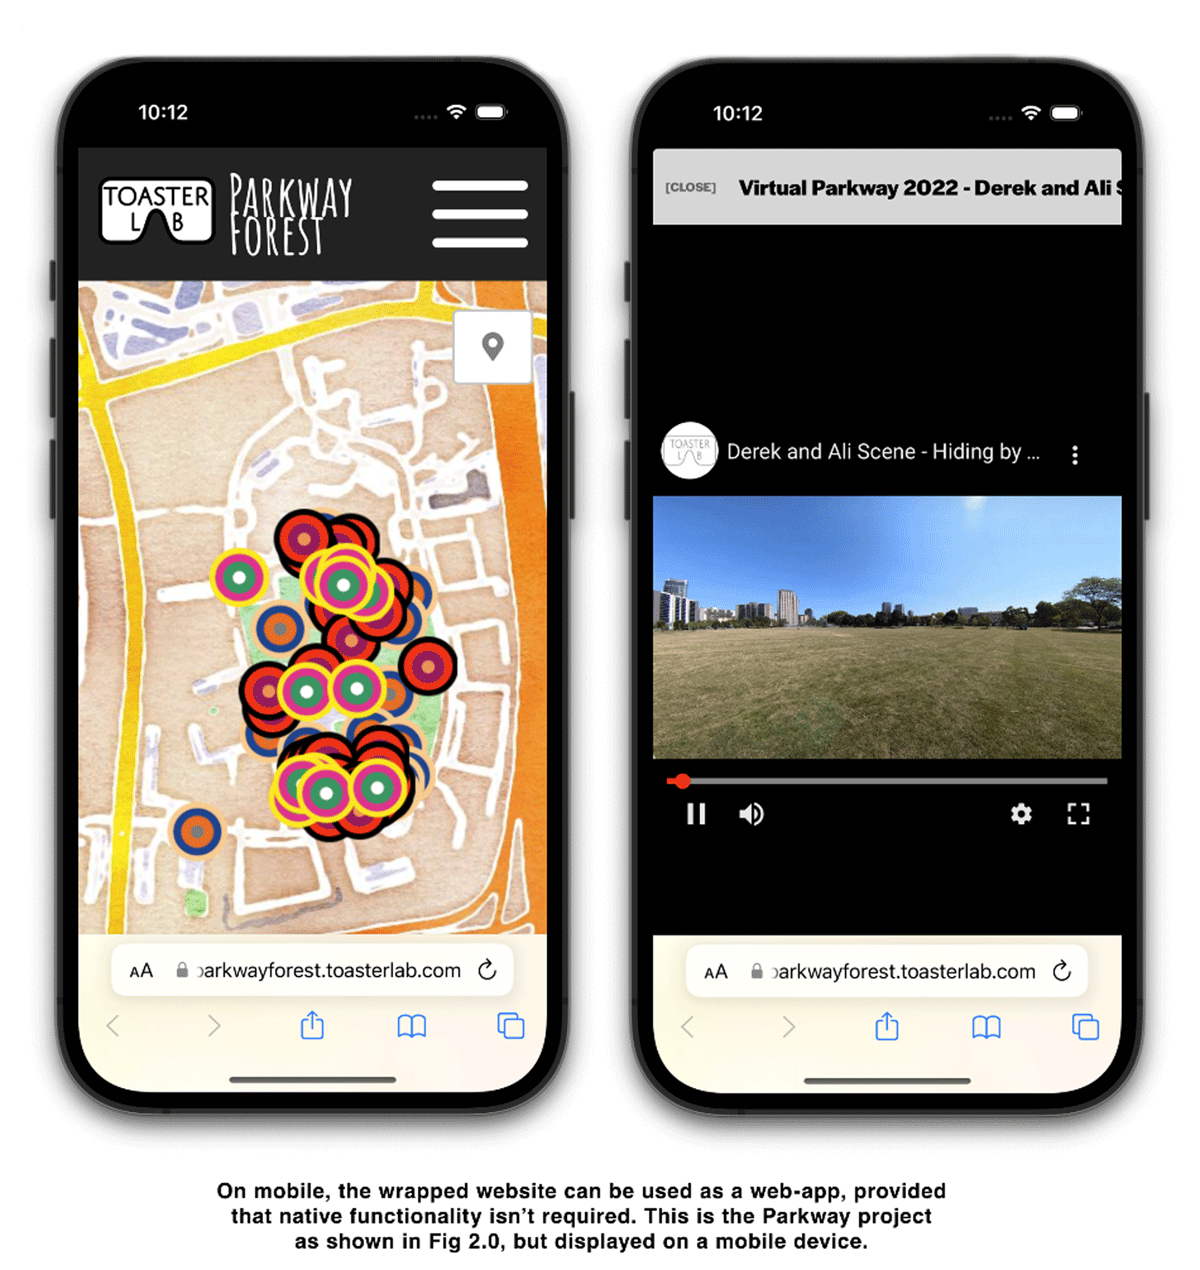
Using The MapTool, we located these 360 videos at specific places in the park where the videos had been made. In some ways this is a very basic use of The MapTool as it is simply a collection of YouTube links stored with coordinates. However, presented together on a map and hosted on a website, this collection of community-made videos constitutes a kind of “official” artifact (Figure 3). The map collects and presents myriad small and transient uses of the park and provides workshop participants with a way to share these experiences with their friends and family (Figure 4). The park itself is a shared space and does not belong to any individual or allow for personal memorials to be built, but through the digital presentation, workshop participants are able to “own” pieces of it and to establish a record of their own experiences and memories.
In many cases, much of the video content is barely legible to outsiders, which underscores the point that power lies in the public presentation of personal record. As expected with content created by novice users who are also mostly children, very few of the videos are smooth productions with a strong narrative and high production value. These videos improve over time (the map now contains video from at least three different workshops spread over several years) but focusing on the production quality of the videos misses the point of this map. The power here lies in giving equal billing to these personal “landmarks” alongside official boundaries. This is not a map for governance or economy but a deep map of community experience.
Case study 3: Authoring tool, TrailOff
The MapTool can also be used as an authoring tool for creating collections of media and establishing relationships between them, which can then be packaged or stored online for network distribution to other software. For instance, a map can be used to link audio recordings to geographic locations. That material can then be bundled, downloaded, and used “offline” by a native mobile application. In this mode, the audience never interacts with The MapTool directly, but rather experiences the interfaces provided by the mobile interface. The MapTool is used to craft a narrative layer on top of geography, but the audience does not experience the tool (or even necessarily a map) directly.
TrailOff
In 2021, The MapTool was used to create a prototype of a dynamic audio tour project called TrailOff. (NB: Currently the project can be found online, but it was later rebuilt by another team using a different system [Swim Pony LLC 2022]. This paper describes the prototype work.) This project began as a call from the Pennsylvania Environmental Council (PEC), who wanted an innovative way to engage the community with a network of urban trails known as the Philadelphia Watershed Trail System. The trails are used for walking, hiking, and wildlife, but in addition to traversing forested and rural landscapes, they also cross industrial areas of heavy manufacturing, railyards, and shipping terminals. By themselves, the trails play an interesting role in the geography of the city, cutting across neighbourhoods and the boundaries of socioeconomic classes and weaving together regions with their own logic and history that do not always track with contemporary or official boundaries and maps. PEC’s goal was to commission a community project that encouraged thoughtful use of this trail system. They especially wanted to encourage new ways of engaging these urban trails for exploration and recreation. These trails are often used by bikers and runners and as shortcuts for locals, but few people walk through these areas recreationally.
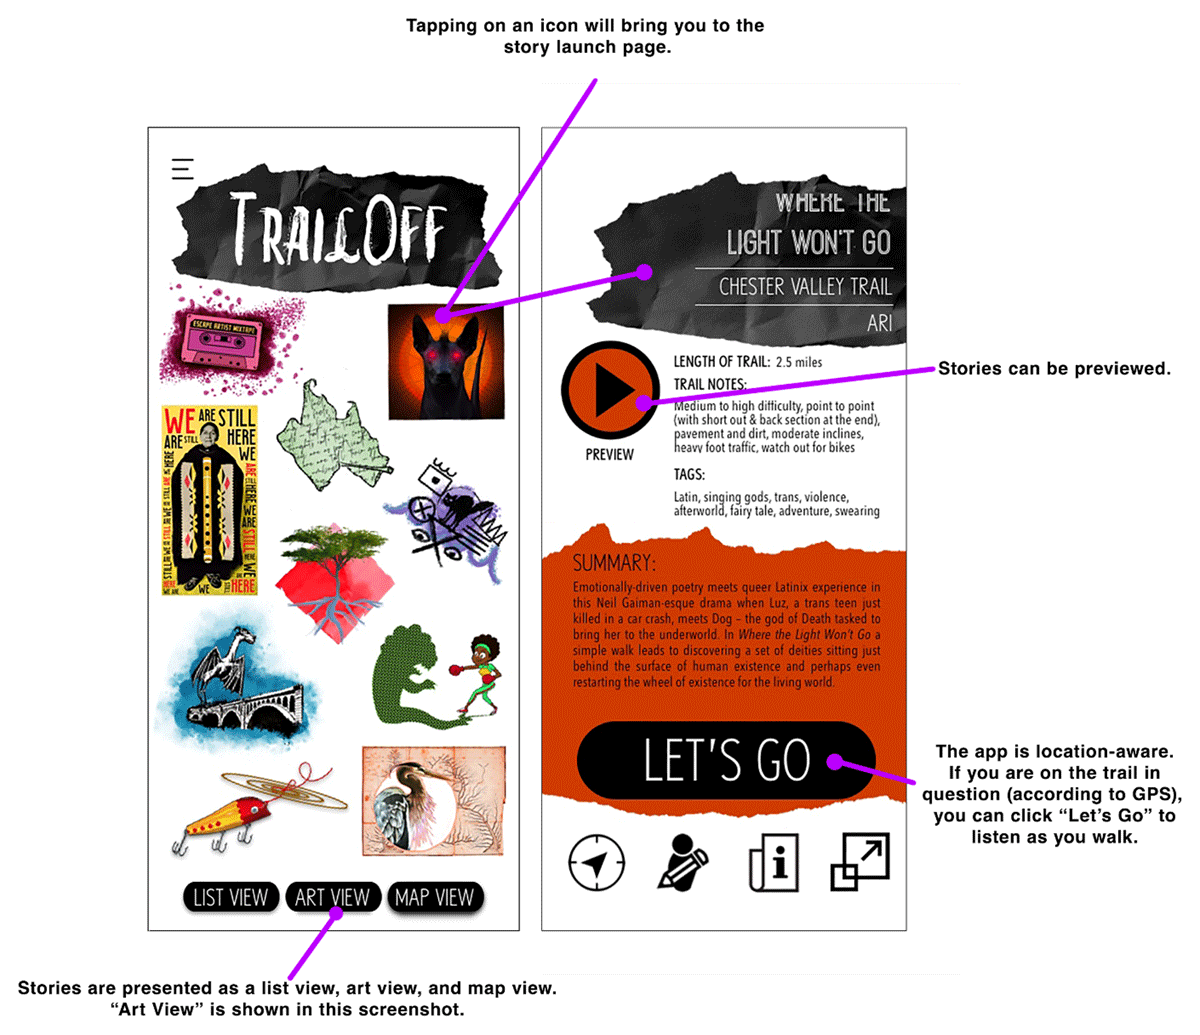
A local theatre company, Swim Pony, was commissioned for this project, and they collaborated with the authors through Toasterlab, the organization that began the Parkway Forest project. Together, we co-constructed a method and system of locative storytelling. The focus was on creating stories that encouraged awareness and engagement with the landscape at a walking pace. Toasterlab began a series of workshops that involved the idea of audio tours, which led to the development of a mobile app that contains ten jury-selected stories by local authors, written as site-specific audio tours. Previews of each story are available on both the website and in the app, but the complete stories can only be heard by physically going to and walking along the trail (Figure 5).
The stories themselves weave in both fictional and non-fictional elements and highlight the voices and narrative truths of communities that make use of the space but are not always included in official record. Author Ari, a spoken word poet and educator, gives us a story about a trans, Latinx teen who dies in a car crash and meets Dog, the god of death, who guides them through the Mesoamerican underworld (Ari 2020). Author Carmen Maria Machado gives us a horror story based on the local urban legend of the Jersey Devil (Machado 2020), and Eppchez!, a “gender-expansive Jewish and Cuban theatre maker,” gives us a story of cruising and of labour disputes told from the perspective of a feral cat (Eppchez! 2020). All of these stories are unique and engaging and not what one might initially expect from an educational audio tour produced by the Parks Commission. The technology of layering allows for these stories to coexist along with information about water usage, the history of the trail, and the surrounding buildings in a way that mixes official, fictional, nonfictional, and experiential realities in the same place.
Conclusion
As we have seen, in addition to its more traditional application as a method for textual analysis, deep mapping can be used as a technique to broaden the scope of who is allowed to tell stories about a place. Deep maps can share experiences and understandings that are not typically expressed by “official” maps. The purpose of this kind of mapping is to show the seams of authorship and to call attention to the notion that places and the stories we tell about them are constructed. Whether in scholarship or in a community setting, interactive mapping creates room for responses and for multiple stories about the same physical space to coexist; co-authorship means shared authority. This, we believe, is an important use for deep mapping: showing that the act of authoring a map in either a community or a scholarly setting can include the process of adding layers (literal and figurative) to an existing map, a gesture which subverts the very notion of authority.
To return to Taylor and colleagues, “The digital map—and particularly the kind of digital deep mapping we have outlined—mediates between the reader and the text in putting forward a visible representation of how reader, writer and text might inhabit the same geographical space” (Taylor et al. 2018, 16). With The MapTool, we add the notion of multiple authors and their narratives about place.
This is consistent with Barbara Piatti’s description of the role of literary mapping as “only one stage in a process of interpretation. Exciting literary-cartographical visualisations do not always provide final answers, but they invariably do support researchers in shaping their interpretations” (Piatti 2016, 91). In fact, the process of mapmaking is in itself an interpretive act, beginning with the platform and continuing through the decisions regarding which elements should be included in each place-based narrative.
To conclude, we return to David Bodenhamer, who writes in Deep Maps and Spatial Narratives: “In their essence, deep maps are the means by which we represent the contested meanings of space and place, as well as the dynamics that produce them” (Bodenhamer 2015, 21). These dynamics, we argue, are embedded in the tools we use to tell stories and, in the process, people, and contexts that produce them.
Acknowledgements
We would like to thank our collaborators Justine and Ian Garrett of Toasterlab and the SwimPony and PEC organizations. Development of The MapTool was funded in part by a grant from the Canada Council for the Arts.
Competing interests
The authors have no competing interests to declare.
Contributions
Authorial
Authorship in the byline lists corresponding author first. Author contributions, described using the NISO (National Information Standards Organization) CrediT taxonomy, are as follows:
Author name and initials:
Anindita Basu Sempere (ABS)
Andrew Sempere (AS)
Authors are listed in descending order by significance of contribution. The corresponding author is ABS.
Conceptualization: ABS and AS
Data Curation: AS and ABS
Funding Acquisition: AS
Investigation: ABS
Methodology: ABS and AS
Software: AS
Writing – Original Draft: ABS and AS
Writing – Review & Editing: ABS
Editorial
Section Editors
Morgan Pearce, The Journal Incubator, University of Lethbridge, Canada
Davide Pafumi, The Journal Incubator, University of Lethbridge, Canada
Chief Copy Editor
Davide Pafumi, The Journal Incubator, University of Lethbridge, Canada
Layout Editor
AKM Iftekhar Khalid, The Journal Incubator, University of Lethbridge, Canada
References
Ackermann, Edith. 2001. “Piaget’s Constructivism, Papert’s Constructionism: What’s the Difference?” Future of Learning Group Publication, 5(3): 85–94. Accessed November 7, 2023. http://learning.media.mit.edu/content/publications/EA.Piaget%20_%20Papert.pdf.
Ari. 2020. “Where the Light Won’t Go [Chester Valley].” TrailOff. Swim Pony LLC and the PA Environmental Council. Apple App Store, Vers. 3.0.7 (2023). Accessed November 7, 2023. https://trailoff.org/story/where-the-light-wont-go.
Bodenhamer, David J. 2015. “Narrating Space and Place.” In Deep Maps and Spatial Narratives, edited by David J. Bodenhamer, John Corrigan, and Trevor M. Harris. 7–27. Bloomington, IN: Indiana University Press.
Bodenhamer, David J. 2016. “Making the Invisible Visible: Place, Spatial Stories and Deep Maps.” In Literary Mapping in the Digital Age, edited by David Cooper, Christopher E. Donaldson, and Patricia Murrieta-Flores. 207–220. New York: Routledge.
Buell, Lawrence. 2009. Writing for an Endangered World: Literature, Culture, and Environment in the U.S. and Beyond. Cambridge, MA: Harvard University Press.
Cooper, David, Christopher E. Donaldson, and Patricia Murrieta-Flores, eds. 2016. Literary Mapping in the Digital Age. New York: Routledge.
Cosgrove, Denis E. 1984. Social Formation and Symbolic Landscape. Madison, WI: University of Wisconsin Press.
Eppchez! 2020. “Appear to Me [Delaware River Trail South].” TrailOff. Swim Pony LLC and the PA Environmental Council. Apple App Store, Vers. 3.0.7 (2023). Accessed November 7, 2023. https://trailoff.org/story/appear-to-me.
Geertz, Clifford. 1973. The Interpretation of Cultures. New York: Basic Books.
Hui, Barbara. 2021. “About Litmap.” Accessed November 7, 2023. http://barbarahui.net/about-litmap.html.
Machado, Carmen Maria. 2020. “River Devil II: The Return [Schuylkill River Trail: Manayunk to Shawmont].” TrailOff. Swim Pony LLC and the PA Environmental Council. Apple App Store, Vers. 3.0.7 (2023). Accessed November 7, 2023. https://trailoff.org/story/river-devil-ii.
Massey, Doreen, and Nigel Thrift. 2003. “The Passion of Place.” In A Century of British Geography, edited by Ron Johnston and Michael Williams. 275–299. Oxford: Oxford University Press.
Mels, Tom, ed. 2004. Reanimating Places: A Geography of Rhythms. Aldershot, UK: Ashgate.
Nowviskie, Bethany, David McClure, Wayne Graham, Adam Soroka, Jeremy Boggs, and Eric Rochester. 2013. “Geo-Temporal Interpretation of Archival Collections with Neatline.” In Literary and Linguistic Computing 28(4): 692–699. Accessed November 7, 2023. DOI: http://doi.org/10.1093/llc/fqt043.
Papert, Seymour. 1980. Mindstorms: Children, Computers, and Powerful Ideas. Brighton: Harvester.
Piatti Barbara. 2016. “Mapping Fiction: The Theories, Tools and Potentials of Literary Cartography.” In Literary Mapping in the Digital Age, edited by David Cooper, Christopher E. Donaldson, and Patricia Murrieta-Flores. 88–101. New York: Routledge.
Piatti, Barbara, Hans Rudolf Bär, Anne-Kathrin Reuschel, Lorenz Hurni, and William Cartwright. 2009. “Mapping Literature: Towards a Geography of Fiction.” In Cartography and Art. Lecture Notes in Geoinformation and Cartography, edited by Antje Lehn, Georg Gartner, and William Cartwright, 1–16. Berlin: Springer. Accessed November 7, 2023. DOI: http://doi.org/10.1007/978-3-540-68569-2_15.
Priestnall, Gary. 2016. “Spatial Frames of Reference for Literature through Geospatial Technologies.” In Literary Mapping in the Digital Age, edited by David Cooper, Christopher E. Donaldson, and Patricia Murrieta-Flores. 240–257. New York: Routledge.
Swim Pony LLC. 2022. “TrailOff.” Apple App Store, Vers. 3.0.7 (2023). Accessed November7, 2023. https://apps.apple.com/us/app/trailoff/id1527184140.
Taylor, Joanna E., Christopher E. Donaldson, Ian N. Gregory, and James O. Butler. 2018. “Mapping Digitally, Mapping Deep: Exploring Digital Literary Geographies.” Literary Geographies, 4(1), 10–19. Accessed May 25, 2023. https://literarygeographies.net/index.php/LitGeogs/article/view/120.

